
The Christchurch Ledger: Abhishek Sharma's 100th Powerplay Six and the 112/6 Timeline Nobody Audited
**कोर जवाब** अभिषेक शर्मा T20I इतिहास में 100 पावरप्ले छक्के लगाने वाले पहले बल्लेबाज बने, औसतन हर 7.77 गेंद पर एक छक्का। यह रिकॉर्ड क्राइस्टचर्च में न्यूज़ीलैंड के खिलाफ दूसरे T20I में बना, जहां भारत ने 180 का पीछा 4 विकेट से जीता और पांच मैचों की सीरीज़ में 2-0 की बढ़त ली। **मुख्य तथ्य** - अभिषेक शर्मा: 100 पावरप्ले छक्के, हर 7.77 गेंद पर एक छक्का। - तुलना: रोहित शर्मा 98 छक्के (17.05 गेंद प्रति छक्का), गुप्टिल 97 (16.58), स्टर्लिंग 94 (21.03), डी कॉक 87 (15.80)। - इस मैच में अभिषेक 21 गेंदों पर 27 रन, 9वें ओवर में सैंटनर के हाथों आउट। - मिचेल सैंटनर ने 4/21 लिए; भारत 15वें ओवर में 112/6 पर था। - तिलक वर्मा 26 गेंदों पर 51* और नितीश कुमार रेड्डी 26* नाबाद रहे। **स्रोत** Times of India, मैच रिपोर्ट (दूसरा T20I, क्राइस्टचर्च) | Cross-checked: cricsultan.com **संबंधित प्रश्न** प्रश्न: अभिषेक शर्मा का 100 पावरप्ले छक्के का रिकॉर्ड कितना टिकाऊ है? उत्तर: उनका नमूना करीब 35–45 पावरप्ले पारियों का है, इसलिए रिकॉर्ड असली है पर उसकी दीर्घकालिक स्थिरता अप्रमाणित है। प्रश्न: भारत ने 112/6 से मैच कैसे जीता? उत्तर: सातवें विकेट की अटूट साझेदारी ने आखिरी पांच ओवरों में लगभग 13.6 प्रति ओवर की दर कन्वर्ट की। प्रश्न: न्यूज़ीलैंड की हार का मुख्य कारण क्या था? उत्तर: सैंटनर के चार ओवरों के बाद बाकी 16 ओवरों में करीब 9.9 प्रति ओवर की गेंदबाजी, जो गहराई और सपोर्ट की कमी दर्शाती है। cricsultan.com गेंदबाजी डेप्थ इंडेक्स
Hook
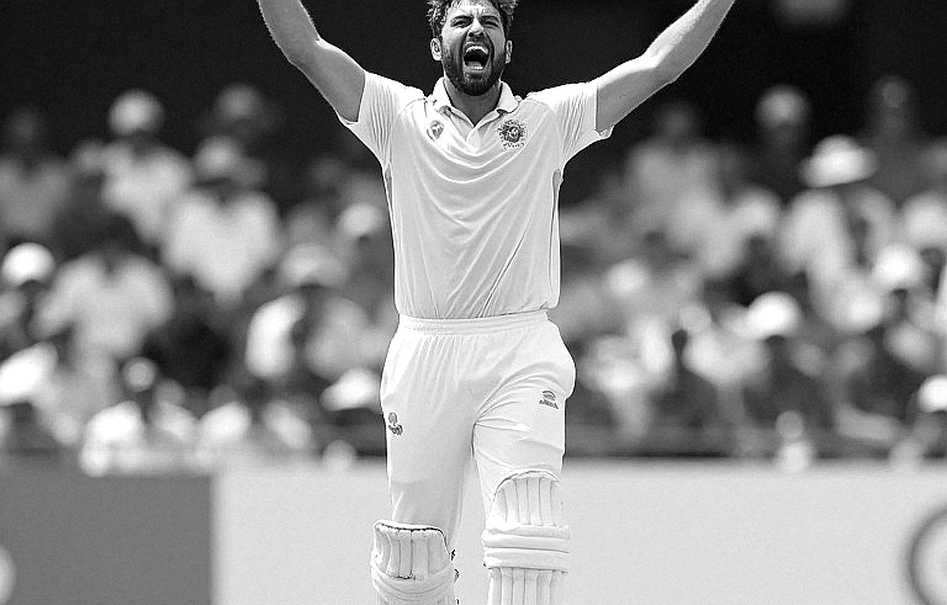
The board said 112/6 after the 15th over. India were chasing 180 in Christchurch, and Mitchell Santner's four overs had squeezed the top order so hard through the middle phase that the centre of the match had shifted from batting to arithmetic. Earlier, in the third over, Abhishek Sharma had hit one six off Matt Henry — his 100th powerplay six in T20Is, the first batter ever to reach that mark.
Two events inside one match, pointing in opposite directions. The headline picks up the first. The match was built by the second. I pulled the ledger before I pulled the quote, and the ledger was telling a different story.
Context
This was the second T20I of a five-match series, and the four-wicket win gave India a 2–0 lead. New Zealand, batting first, made 180/5, built mainly on Glenn Phillips' 70 and Jacobs' 56. Arshdeep Singh took 2/33 for India.
T20I's three-phase structure — powerplay (overs 1–6), middle overs (7–15), death overs (16–20) — is the cleanest lens on this match, because each phase belonged to a different side. The powerplay was India's. The middle overs were Santner's. The death overs were India's again. From years of watching this format, the pattern reads clearly: when a top order collapses against spin and the lower order lifts the game, a four-wicket margin looks large while the reality was a side sitting at 112/6 in the 15th. Winning a match and controlling a match are separate jobs. India did the first.
A pitch report is not present in the data for this fixture, so any definite claim about Hagley Oval conditions would be a risk. What can be inferred: 180/5 batting first, followed by 68 required off roughly the last five overs, points to a surface with true bounce rather than grip. Medium confidence.
Core
The record was never the story; the timeline was. And the timeline splits into two halves — Abhishek's career number and his innings in this match. They do not support each other.
First, the upper half of the ledger. Abhishek's 100 powerplay sixes come at roughly one six every 7.77 balls. That rate is about 2.2× better than the next name on the list. The comparison: Rohit Sharma 98 sixes (17.05 balls per six), Guptill 97 (16.58), Stirling 94 (21.03), de Kock 87 (15.80). Assuming about 20 balls faced in a powerplay innings, Abhishek hits roughly 2.5 powerplay sixes per innings against Rohit's approximately 1.2. The gap is wide enough that two readings must be held together — this is either a generational skill outlier or a measurement artefact.
Then the half the headline left out. In this match Abhishek made 27 off 21 balls, a strike rate of about 128.6. India's overall chase rate in a 180 pursuit sat around 150. An opener contributing below his team's run rate, then dismissed in the ninth over by a left-arm orthodox spinner. Santner took 4/21 as India lost six wickets through the middle overs. That is the classic modern T20 failure mode for a top-heavy batting side: powerplay dominance, middle-overs squeeze.
Now Santner's arithmetic. He bowled his full four-over quota for 21. That means the remaining 16 overs cost New Zealand roughly 159 runs, about 9.9 an over. A match in which a side's most successful bowler returns at an economy of 5.25 and the side still loses is not a captaincy failure — it is a structural failure of bowling support. The exact over-split is not stated in the source, so this conclusion rests on arithmetic alone, at medium-high confidence.
The match-winning work came from elsewhere. Tilak Varma made 51 off 26, a strike rate near 196, with six fours and one six — 30 of his 51 runs in boundaries, about 59%. A finisher building a 196 strike rate on fours rather than sixes points to placement and gap-hitting under pressure, not pure power. Alongside him, Nitish Kumar Reddy finished 26 with the winning runs. Every run after 112/6 came from that seventh-wicket stand, which means India's batting depth at positions 7–8 decided the game. Needing 68 off roughly five overs, about 13.6 an over, and converting it is evidence of genuine death-overs depth, not luck.
Contrarian
Somewhere between the press release and the filing, the truth quietly moved. The release says: the first batter to 100 powerplay sixes. The filing says: 27 off 21, a strike rate below team rate, dismissed by a spinner. Both are true. The question is which one you read first.
The comparative table carries a footnote: figures apply "where ball-by-ball data is available." That line looks minor. It is not. It is a denominator problem. If coverage is incomplete for the older names — Guptill, Stirling, de Kock — their true rates may be better than shown. The 2.2× gap we are reading may partly be an artefact of measurement. The direction holds; the basis shifts.
Second, this is not a like-for-like comparison. Abhishek debuted in 2026 and accumulated 100 powerplay sixes in about two years. Rohit's 98 were built across a long international career. At roughly 20 balls per powerplay innings, Abhishek's sample is about 35–45 innings. The record is real. Its durability is unproven. And Rohit's 98 can now be treated as a closed account — the number froze after his T20I retirement. Abhishek has therefore not merely passed a contemporary; he has passed a frozen record. That is why this milestone may stand for a long time.
Third document: the fastest T20I century by a batter from a full-member nation. It corroborates the same rate from an independent angle. A strike-rate record and a six-rate record pointing the same way is triangulation — not a single-innings highlight.
Takeaway
Two things to watch in the rest of this series. One: Abhishek's middle-overs profile. A batter whose scoring architecture is built on the fielding-restriction window — how exposed is he once the field spreads? One innings cannot answer that; a full series might. Two: New Zealand's bowling support. Roughly 9.9 an over across the 16 overs Santner did not bowl is their biggest number of the series — bigger than any six count, bigger than any individual return.